Simulating plausible ballot paper preferences from STV count sheets
Introduction
When analysing single transferable vote (STV) elections, we often desire a record of the preferences lodged by voters, so that voting patterns can be analysed in detail, or to see how changes in voters' preferences or in the rules of the count might impact the result. Databases of full ballot paper preferences for STV elections are available, such as stvdb and Nicolaus Tideman's database.
The elections were such data is available, however, form an overwhelming minority of all STV elections. For the vast majority of STV elections, the only information released is the STV count sheet, which summarises the number of votes held by each candidate at each stage of the count, but does not carry ballot paper-level granularity.
Previous models have been proposed to simulate ballot paper preference data from STV count sheets, such as [1]. However, that model has an upfront reliance on pooling data from multiple elections and examining transfers only from the first stage of the count, which is of limited value when applied to a single election. In this post, I more concretely describe an approach to simulating plausible ballot paper preference data from a single STV count sheet.
Principles of the model
The key assumption in this model, which enables plausible ballot paper preference data to be simulated, is that the probability of a candidate A being followed by a candidate B in a voter's preferences is approximately equal to the probability of a ballot paper being transferred from candidate A to candidate B.
We can then imagine a Markov chain, where the nodes are candidates in the election, and the transition probabilities are the probabilities identified above. We can then simulate ballot paper preference data by repeatedly executing random walks on the Markov chain.
This particular model implies a type of independence, where the probability of a candidate A being followed by a candidate B is independent of whatever candidates preceded A in the voter's preference list. This is not guaranteed to be true, but as we will see, it does not prevent the model from producing ballot paper preference data which, when counted, closely matches the true election result.
The other limitation is that STV only permits transfers between continuing candidates, so if a candidate is excluded at a late stage of the count, we will not be able to observe transition probabilities between the excluded candidate and any previously excluded candidates, nor can we even estimate how many subsequent preferences would have been expressed for the previously excluded candidates in total. However, this will not affect the result when we use the simulated preferences to conduct counts, so long as the order of election and exclusion is sufficiently similar to that in the real election, i.e. if we use similar rules to the real count, and the independence assumption above is not greatly violated.
An example of the process
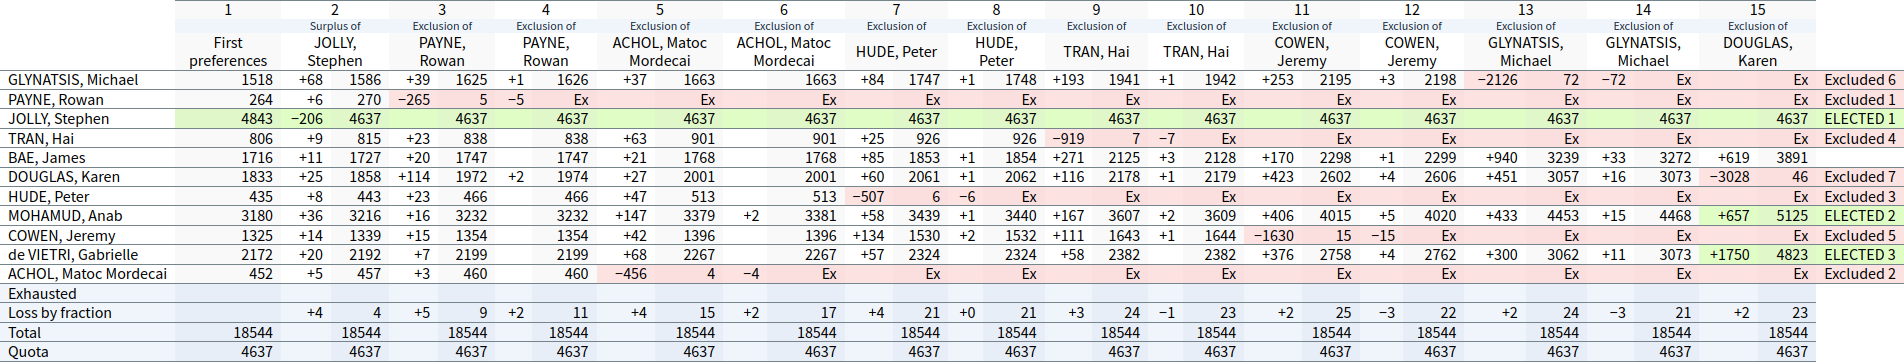
Consider the election for 3 councillors in Yarra City Council, Langridge ward in 2020.
From the count sheet, we can note how many votes1 were transferred in the first stage from Stephen Jolly to the other candidates. For example, Stephen Jolly was followed by Michael Glynatsis on 64/192 = 33.3% of votes, so in our Markov chain, the transition probability from Stephen Jolly to Michael Glynatsis will be 33.3%.
The next 2 stages are the exclusion of Rowan Payne, so we can similarly calculate the transition probabilities from Rowan Payne to each other candidate – with the exception of Stephen Jolly, who has already been elected. As previously discussed, we are unable to estimate the probability that Rowan Payne is followed in a voter's preferences by Stephen Jolly, but so long as, when the simulated ballots are counted, Stephen Jolly is also elected before Rowan Payne's exclusion, this is irrelevant.
We can continue in this way until we have derived transition probabilities from every candidate – with the exception of James Bae, who is never required to be excluded, and Anab Mohamud and Gabrielle de Vietri, who are elected in the final stage and so no votes are transferred from them. Again, so long as, when the simulated preferences are counted, these candidates finish in a similar situation, this will not affect the result.
For the 2020 Langridge election, we obtain the following transition probabilities:
| To | |||||||||||
|---|---|---|---|---|---|---|---|---|---|---|---|
| From | GLYNATSIS | PAYNE | JOLLY | TRAN | BAE | DOUGLAS | HUDE | MOHAMUD | COWEN | de VIETRI | ACHOL |
| Ballot start | 8.1% | 1.4% | 26.1% | 4.2% | 9.3% | 9.8% | 2.3% | 17.3% | 7.1% | 11.9% | 2.4% |
| GLYNATSIS | 44.4% | 21.0% | 20.5% | 14.1% | |||||||
| PAYNE | 15.9% | 7.8% | 8.5% | 39.3% | 10.4% | 6.3% | 7.4% | 2.6% | 1.9% | ||
| JOLLY | 33.3% | 3.1% | 4.7% | 5.2% | 12.5% | 3.6% | 17.7% | 6.8% | 10.4% | 2.6% | |
| TRAN | 20.7% | 31.0% | 12.3% | 19.0% | 11.4% | 5.6% | |||||
| BAE | |||||||||||
| DOUGLAS | 20.6% | 21.9% | 57.5% | ||||||||
| HUDE | 16.5% | 5.1% | 17.9% | 12.2% | 11.4% | 25.2% | 11.6% | ||||
| MOHAMUD | |||||||||||
| COWEN | 14.9% | 11.1% | 25.4% | 24.5% | 24.2% | ||||||
| de VIETRI | |||||||||||
| ACHOL | 8.8% | 14.0% | 5.0% | 6.4% | 9.2% | 30.7% | 9.4% | 16.4% | |||
Starting at the ‘Ballot start’ node, we can then simulate a ballot paper's preferences by performing a random walk according to these transition probabilities, ignoring transitions to candidates appearing earlier in the ballot paper's preferences. When we reach a state where no further transitions are possible, we finish the preference list for that ballot paper. By repeating this process, we can simulate many ballot papers.
Performance of the model
The image below shows the result of counting simulated ballot papers for the 2022 Langridge election. To reduce the variation associated with random walks on the Markov chain, 10 times as many ballot papers have been simulated as the real election, and each one weighted one tenth of a vote.
Compared to the real count sheet, the set of elected candidates is the same, the candidates are elected and excluded in the same order and the margins in the final stage are similar:
| Candidate in final stage | Real result | Simulated result2 | % difference |
|---|---|---|---|
| BAE, James | 3904 | 3891 | 0.3% |
| MOHAMUD, Anab | 5129 | 5125 | 0.08% |
| de VIETRI, Gabrielle | 4824 | 4823 | 0.02% |
Considering how close the real election was at some stages,3 this is impressive accuracy.
The 2020 Langridge election is noteworthy because it was the subject of a countback in 2022 to fill a vacancy created by Gabrielle de Vietri ceasing to be a councillor. In a subsequent post, I will detail how data from the countback can be used to further refine the simulated ballot paper data, and how this can be used to evaluate the plausibility of the countback result being affected by different choices of countback rules.
The code
The following Python code takes as input a CSV file. The first row specifies the names of the candidates. The second row specifies the first preference votes for each candidate. Subsequent rows specify the number of votes transferred to or from each candidate at each stage. Simulated ballot papers are generated which can then be output to file.
import csv
import itertools
import multiprocessing
import numpy as np
import sys

BALLOTS_TO_GENERATE = 185500  # 10 times the real number of ballots, to reduce sampling variation

np.random.seed(0)

with open('Langridge_Votes.csv', 'r', newline='') as f:
	reader = csv.reader(f)

	candidates = next(reader)

	counts = np.full((len(candidates) + 1, len(candidates)), 0)  # len(candidates) index = "start" node

	counts[len(candidates), :] = [int(v) for v in next(reader)]

	for row in reader:
		source_candidate = next(i for i, v in enumerate(row) if int(v) < 0)

		for i, v in enumerate(row):
			if int(v) > 0:
				counts[source_candidate, i] += int(v)

probabilities = np.full((len(candidates) + 1, len(candidates)), -1, dtype=float)

# Normalise
for i in range(len(candidates) + 1):
	total = sum(v for v in counts[i, :] if v > 0)
	probabilities[i, :] = [v / total if v > 0 else -1 for v in counts[i, :]]

def walk_chain(_=None):
	result = [-1]

	while True:
		next_nodes = [i for i in range(len(candidates)) if probabilities[result[-1], i] > 0 and i not in result]

		if not next_nodes:
			# No available transition probabilities
			break

		next_probabilities = probabilities[result[-1], next_nodes]
		next_probabilities = next_probabilities / next_probabilities.sum()

		result.append(np.random.choice(next_nodes, p=next_probabilities))

	return result[1:]

# Generate ballots
ballots = []

with multiprocessing.Pool() as pool:
	for b in pool.imap_unordered(walk_chain, range(BALLOTS_TO_GENERATE), chunksize=1000):
		ballots.append(b)

...  # Output ballots to file
References
- Wichmann BA. Producing plausible party election data. Voting Matters. 1996;(5):6–10. https://www.votingmatters.org.uk/ISSUE5/P3.HTM
Footnotes
-
To ensure each ballot paper is weighted equally in total across all the estimated transition probabilities, we count vote transfers rather than ballot paper transfers. ↩
-
Sums do not exactly balance due to current limitations of the counting software, which does not segment exclusions in the same way as the real count. ↩
-
At the time of their respective exclusions, Matoc Mordecai Achol trailed Peter Hude by only 7 votes, and Michael Glynatsis trailed James Bae by 169. If James Bae is excluded rather than Michael Glynatsis at this point, a different set of winners is likely obtained. ↩